When discussing system performance, engineers often default to familiar metrics:
"How many requests per second can it handle?"
But this question, while common, misses the bigger picture.
Real system performance isn't about a single number. It's about understanding how HTTP has evolved, how different metrics relate to each other, and which ones actually drive engineering decisions.
The metrics that matter aren't always the ones we measure first.
The HTTP Evolution: From 1.0 to 3.0
Understanding system performance starts with understanding how HTTP has evolved.
Each version brought fundamental changes:
- •HTTP/1.0: One request per connection
- •HTTP/1.1: Persistent connections, pipelining
- •HTTP/2: Multiplexing, header compression
- •HTTP/3: QUIC protocol, connection migration
These changes fundamentally alter how we measure performance. What worked for HTTP/1.1 doesn't apply to HTTP/3.
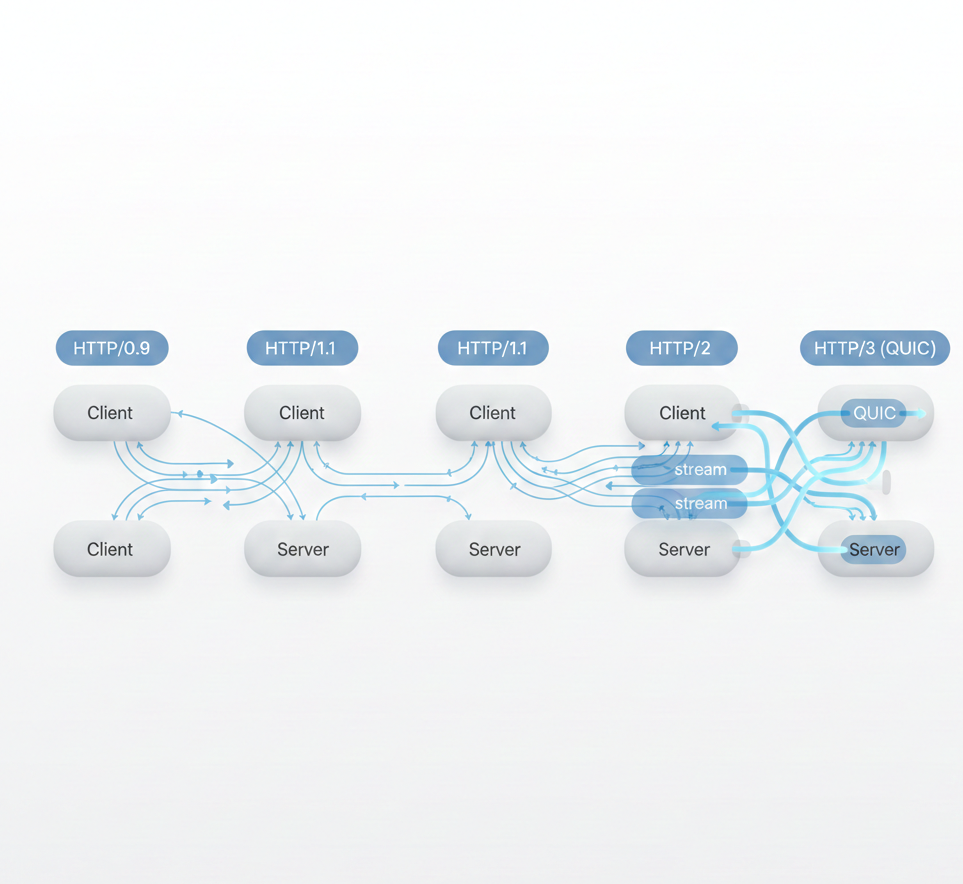
HTTP evolution: from sequential requests to multiplexed streams
QPS: The Most Misunderstood Metric
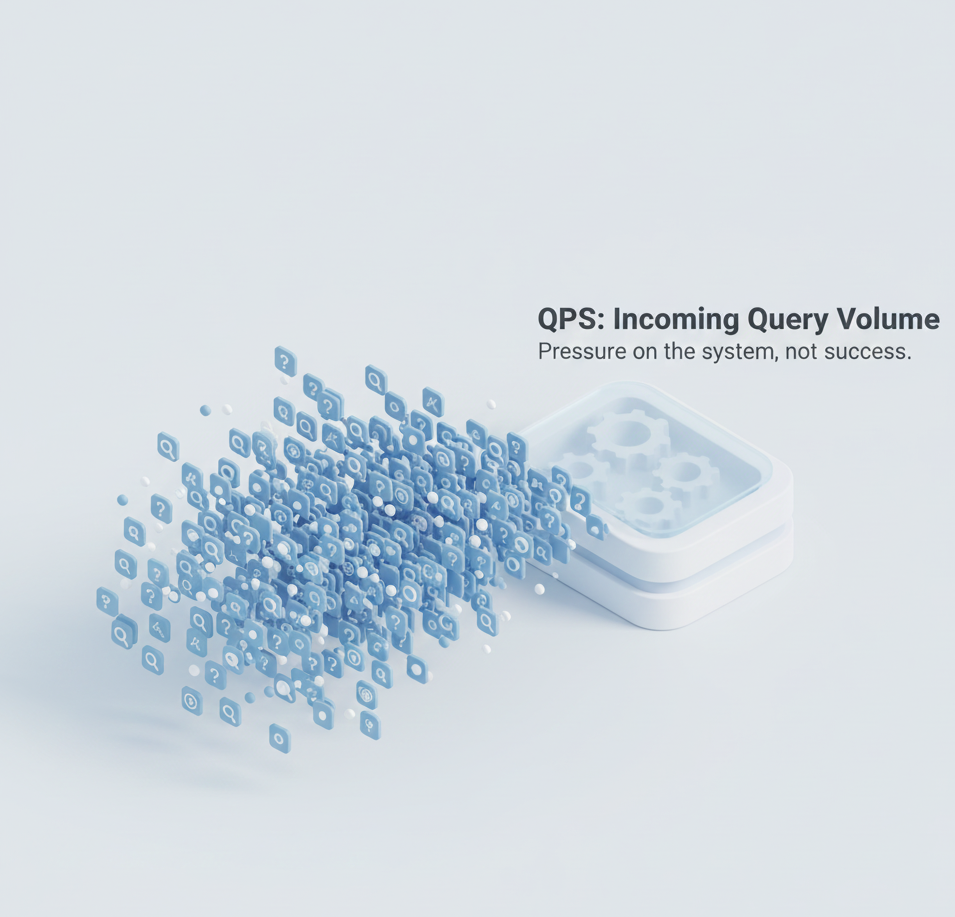
Queries Per Second (QPS) is often the first metric engineers reach for.
But QPS alone tells you almost nothing about system health:
- ⚠1000 QPS with 5ms response time is very different from 1000 QPS with 500ms response time
- ⚠QPS doesn't reveal concurrency patterns
- ⚠QPS can hide resource exhaustion
The real question isn't "How many QPS?" but rather:
- →What's the QPS at acceptable response times?
- →How does QPS change under load?
- →What's the QPS-to-resource ratio?
QPS without context: same number, very different system states
TPS: When Business Logic Matters
Transactions Per Second (TPS) is closer to business reality than QPS.
A transaction might involve:
- •multiple database queries
- •external API calls
- •cache operations
- •message queue interactions
TPS gives you a better sense of:
- ✓actual business throughput
- ✓end-to-end system capacity
- ✓realistic load expectations
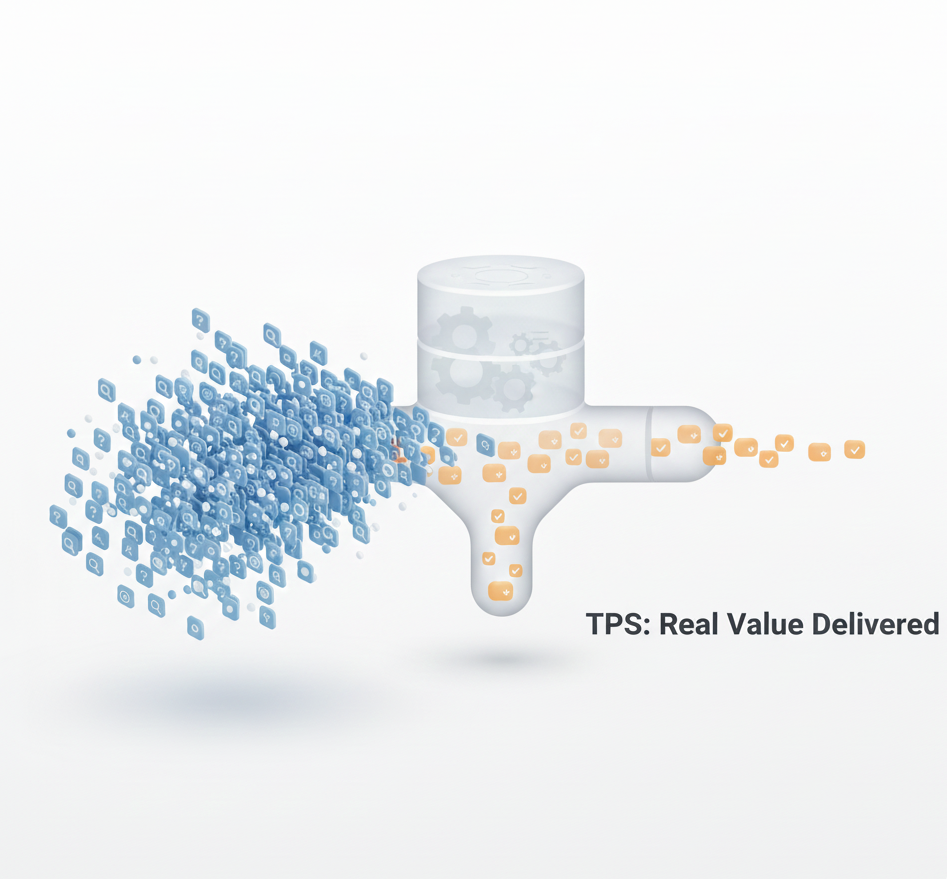
Transaction: one business operation, multiple system interactions
Concurrency: The Hidden Dimension
Concurrency is where most performance issues hide.
Two systems can have identical QPS but very different concurrency patterns:
System A:
1000 QPS, 10 concurrent connections, 10ms response time
System B:
1000 QPS, 1000 concurrent connections, 1000ms response time
Same QPS. Completely different system behavior.
Concurrency reveals:
- →resource contention patterns
- →connection pool efficiency
- →bottleneck locations

Same QPS, different concurrency: the hidden performance dimension
Response Time: The User's Reality
Response time is the metric users actually experience.
But response time distributions matter more than averages:
- ✓P50: median experience
- ✓P95: 95% of users
- ✓P99: worst-case scenarios
A system with 50ms average but 2000ms P99 is broken, even if the average looks good.
Percentiles reveal what averages hide.
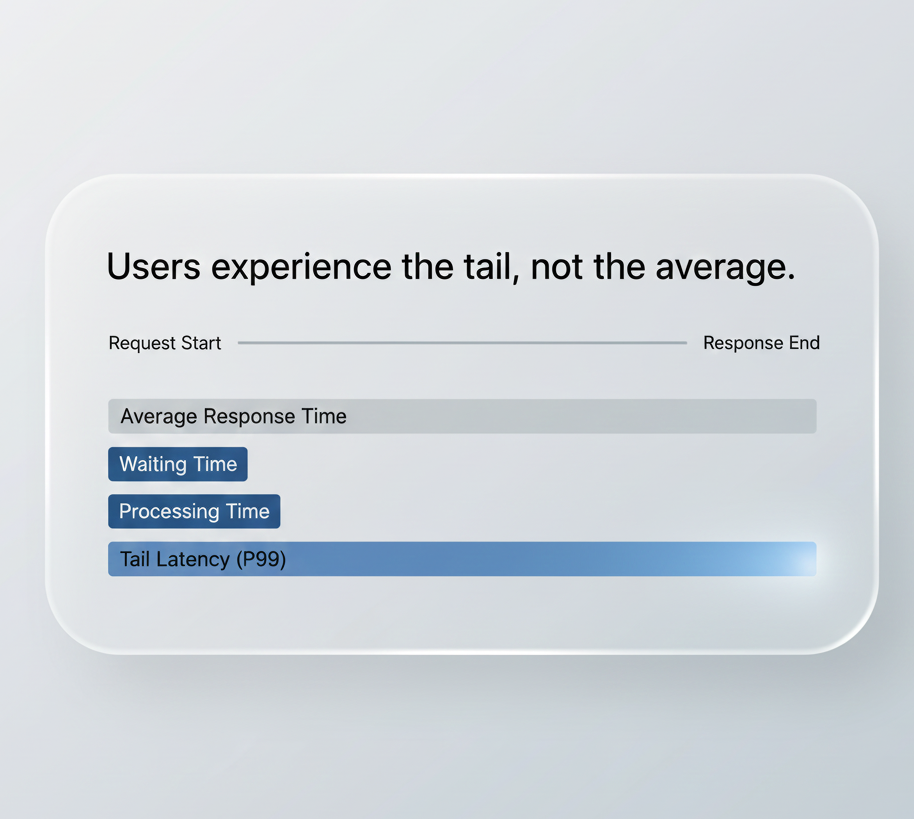
Response time percentiles: the distribution tells the real story
The Relationship Between Metrics
These metrics don't exist in isolation. They're connected:
QPS = Concurrency / Average Response TimeThis relationship means:
- •improving response time increases QPS capacity
- •increasing concurrency requires managing response time
- •optimizing one metric affects all others
You can't optimize metrics independently. They're a system.
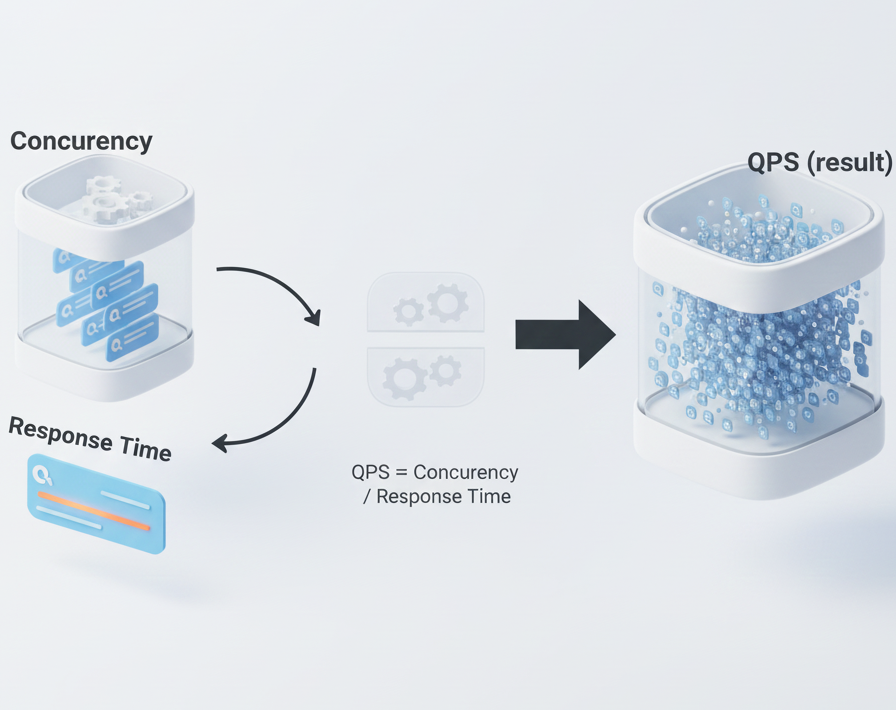
QPS = Concurrency / Response Time: the fundamental relationship
A Practical Example: Nginx Configuration
Consider an Nginx reverse proxy configuration:
The worker_connections setting directly impacts concurrency. But it's meaningless without understanding:
- →upstream response times
- →request patterns
- →connection reuse efficiency
Tuning worker_connections without context is guesswork.
Configuration decisions require understanding the full metric picture.
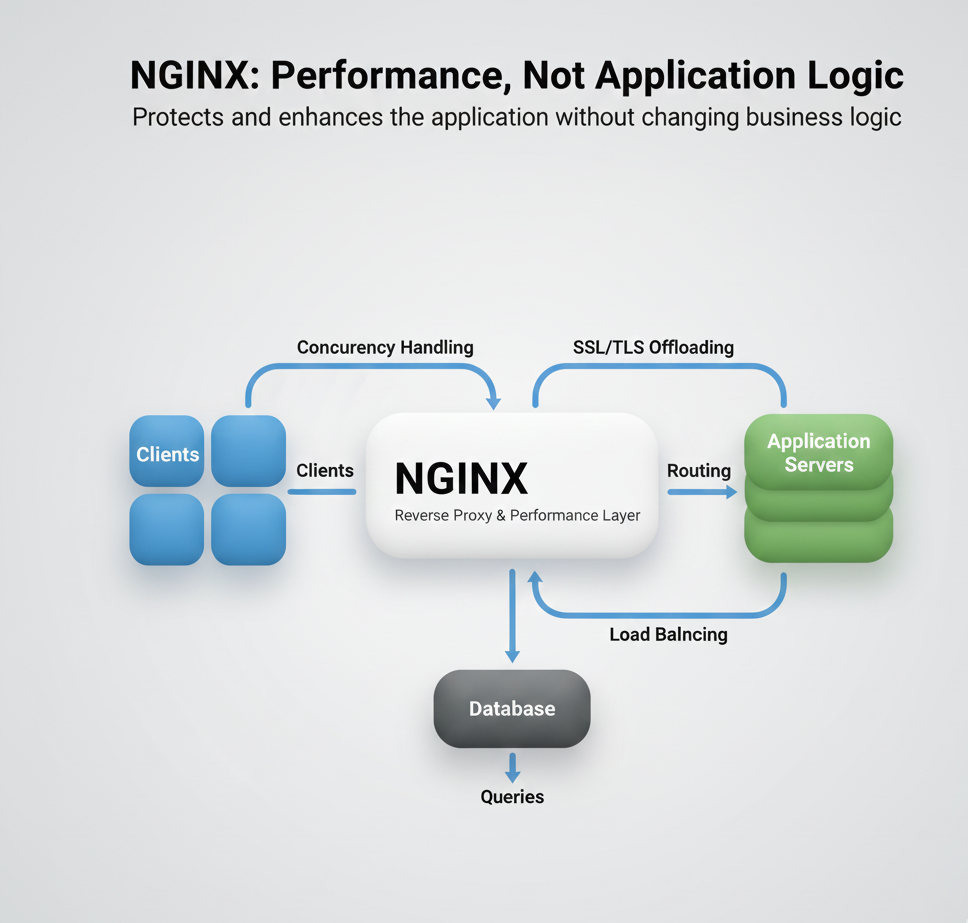
Nginx architecture: how worker_connections relates to concurrency, QPS, and response time
Conclusion
System performance isn't about finding the one perfect metric.
It's about understanding how HTTP has evolved, how metrics relate to each other, and which combinations actually drive engineering decisions.
The metrics that matter:
Before optimizing a single number, you need to understand:
- →the relationships between metrics
- →which metrics matter for your use case
- →how HTTP evolution changes the rules
Understand the metrics — and the system follows.
Written by
Youssef Laidouni
Full Stack Engineer | Java • Angular • PHP | APIs, MVP, Performance & Automation